SIGNAL · 01
Shortages are growing
The gap gets bigger every month, but nobody knows in which group.
Stock counts + analytics
We count your warehouse and turn the results into charts and figures: which category, which zone and what caused each discrepancy — all visible at a glance.
Signals
SIGNAL · 01
The gap gets bigger every month, but nobody knows in which group.
SIGNAL · 02
Slow-moving goods take up the warehouse and your working capital.
SIGNAL · 03
Orders get cancelled and customers are left waiting.
SIGNAL · 04
Guesses, not numbers, decide what to buy more of.
Report
How closely records match reality — for the whole warehouse and for each zone.
The value of missing goods, broken down by category.
Goods on the shelf but not in the records — often a sign of paperwork errors.
Cases where similar items were swapped: one short, the other over.
Services
A full count with scanners, reconciled with your records.
The cause of every discrepancy: receiving, storage, paperwork or mix-ups.
Which products bring in the most revenue and which should be checked more often.
Error density across warehouse zones — see where problems cluster.
Based on the analysis, we plan how often each product should be counted.
A short, clear summary and next steps for management.
Sample
Process
We agree the goal: a count only or an in-depth analysis.
Balances, sales and stock movements are exported from your system.
Counting with scanners; discrepancies are rechecked.
Discrepancies are grouped by category, zone and cause.
We walk management through the report and conclusions.
Calculator
Estimated price
from 12 mln UZS
Module share
An estimate only, not a public offer. We quote an exact price after reviewing your data and the site.
Industries
A shortage map by branch, ABC analysis and stock turnover — on one dashboard.
Turnover and stock trends.
Batch and expiry control.
Raw material use and balances.
Returns and fulfilment.
A separate report for each client’s goods.
Expiry dates and write-offs.
Heavy and piece goods.
Clients
Companies that trust us with their warehouses.









News
Useful reads on warehouses, stock counts and audits.
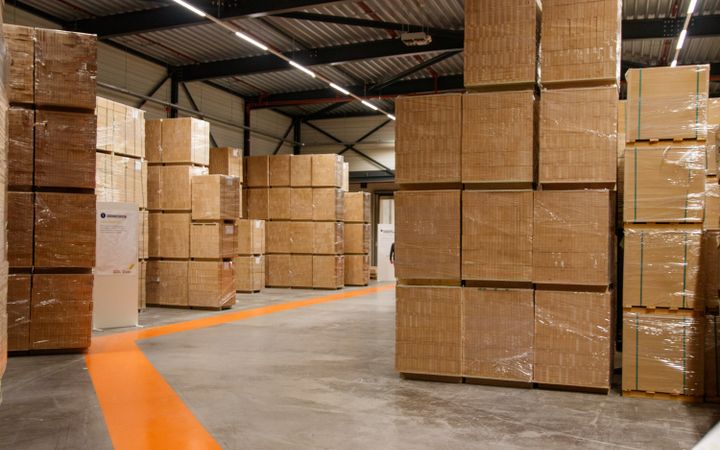 Warehouse data: what to measureYou do not need to measure everything: stock accuracy, turnover, order completeness and losses are enough.
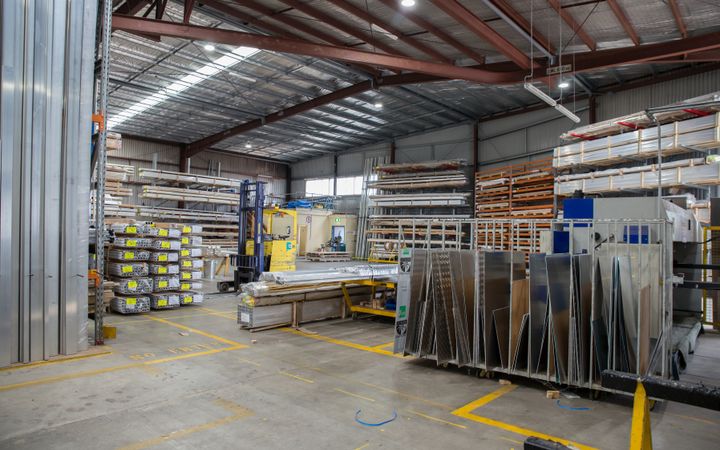 How inventory accuracy is calculatedDivide the number of positions that matched the records by the number counted and multiply by 100.
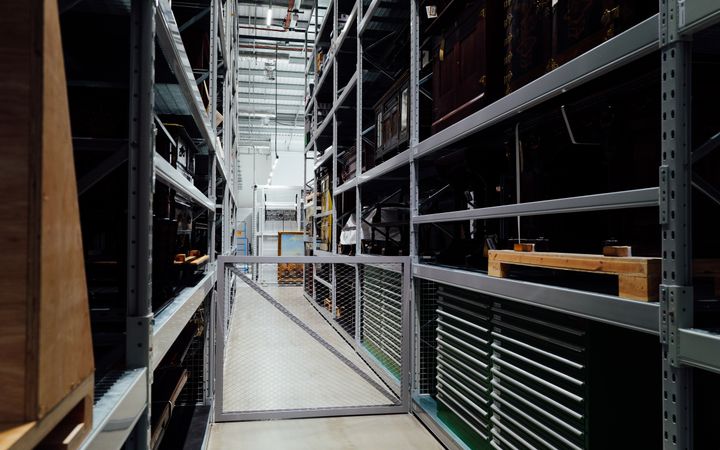 What the turnover ratio isDivide the cost of goods sold in a period by average inventory and you learn how many times stock turned over.
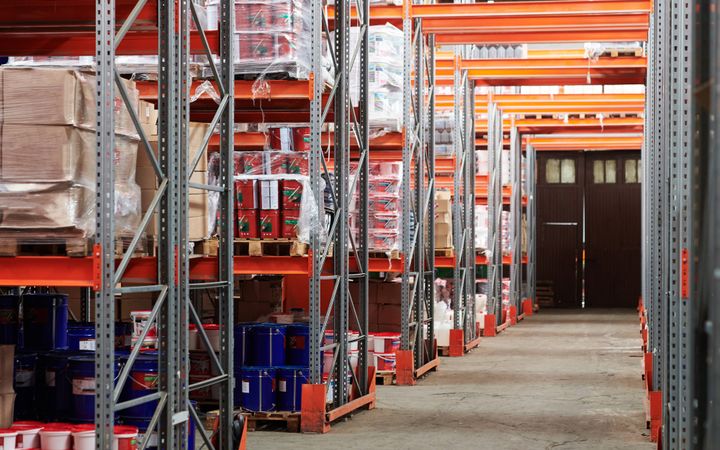 How many days stock stays in the warehouseDays of stock come from dividing 365 by the turnover ratio and are easier to grasp.
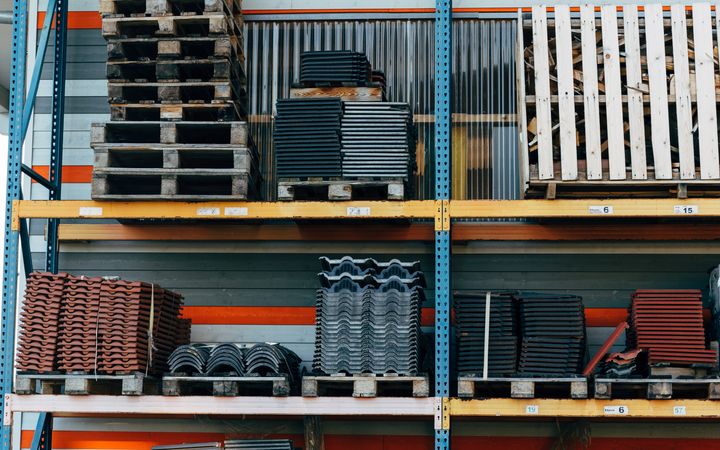 Fill rate: how much of each order is fulfilledIt shows what share of the quantity a customer asked for was actually supplied from stock.
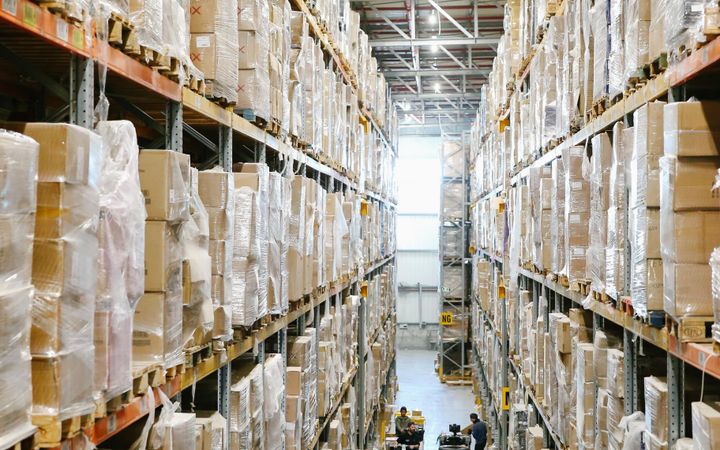 The stock-out rateThe share of days when an item was unavailable at the moment of demand is the main sign of lost sales.
FAQ
Balances, receipts and issues, and sales from your accounting system. We adapt to your format.
Contact
Leave a request — an analyst will call you back, explain what data is needed and give you a price.